

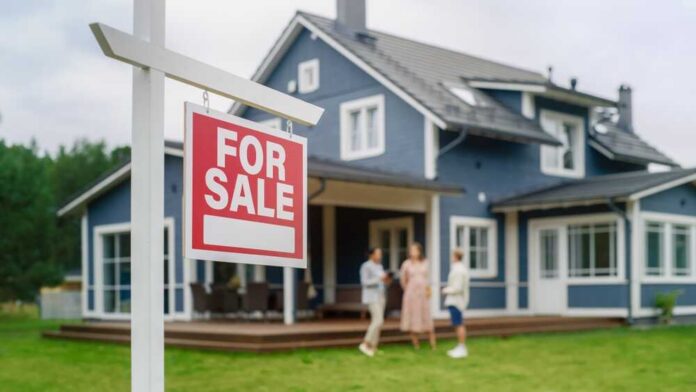
Home prices in Austin are falling faster than in any other major American city, dropping more than 8% in a single year on a price-per-square-foot basis.
Quick Take
- Austin, Tampa, and Memphis led all 50 largest U.S. metros in home price declines through August 2026.
- Austin’s per-square-foot price fell 8.1% year over year, the steepest drop of any major metro.
- The pattern has held steady for months, showing up in reports from March through August 2026.
- Sun Belt cities that boomed during the pandemic are now seeing the sharpest corrections.
Three Cities Are Leading The National Price Slide
Realtor.com’s August 2026 housing report names the three biggest losers by name. Austin home prices per square foot fell 8.1% year over year. Tampa dropped 5.6%. Memphis fell 4.1%.
These numbers come from the 50 largest metro areas in the country, and the same three cities topped the list in July too, with Austin down 8.5%, Memphis down 6.0%, and Tampa down 4.8%.
This isn’t a one-month fluke. Realtor.com’s May 2026 report also showed Austin and Memphis near the top, with Austin sliding 8.3% and Memphis dropping 5.9%. Buffalo, not Tampa, rounded out that month’s top three.
In March, Austin fell 7.1% and Memphis dropped 6.3%, with San Antonio joining them instead of Tampa. The exact order shifts slightly by month, but Austin and Memphis show up again and again.
Why Austin And Tampa Keep Showing Up On Every List
Zillow’s own data backs up the trend from a different angle. Its 2025 research found Tampa’s typical home value down 6.2% year over year and Austin down 6%, both among the steepest declines in the country.
A later Zillow snapshot put Austin at $426,454, down 6.10%, and Tampa at $356,298, down 6.09%. Two different companies, two different methods, same two cities near the bottom.
Federal Reserve data adds another layer. Tampa’s Case-Shiller home price index, tracked through the Federal Reserve Bank of St. Louis, showed barely any movement between April and June 2026, sitting near 369 both months.
That index measures actual closed sales over time, not just what sellers ask for their homes. Seeing it flatten out in the same direction as the listing data adds real weight to the story.
The US cities where home prices are falling the fastest https://t.co/u5mslbv6At
— FOX Business (@FoxBusiness) September 9, 2026
What’s Driving The Slide In These Sun Belt Markets
Austin, Tampa, and Memphis all share a common history. They boomed hard during the pandemic years as buyers fled expensive coastal cities for cheaper Sun Belt living.
Builders responded by throwing up new homes at a breakneck pace. Now that oversupply is catching up with these markets, and sellers are cutting prices to compete with all the fresh inventory sitting on the market.
Housing economists have flagged this overbuilding pattern as a direct driver of price weakness across the Sun Belt and West Coast. One recent estimate placed the national housing shortfall at 1.2 million homes overall, even as oversupply hits specific fast-growing regions.
That’s the paradox of this moment. The country still needs more homes in many places, but Austin, Tampa, and Memphis built too many too fast, and now they’re paying the price at the closing table.
What The Numbers Actually Measure
It matters that most of these figures track list prices per square foot, meaning what sellers are asking, not always what buyers actually pay at closing.
Realtor.com’s own data shows the national median listing price has now fallen for seven straight months, marking the sharpest annual drop the company has recorded since it started tracking data in 2017. That’s a sign sellers nationwide are pulling back, not just in these three cities.
Home listing prices per square foot fell year over year in 60 of the 100 metros Realtor.com now tracks, with the national median list price down roughly 2.5%.
Austin, Tampa, and Memphis simply sit at the extreme end of a much broader cooling trend. For buyers who’ve waited years for the market to turn, that’s a meaningful shift. For sellers who bought at the peak, it’s a harder pill to swallow.
Homeowners in these three cities aren’t facing a crash so much as a correction after years of unsustainable growth.
Prices climbed far past what local incomes could support, and the market is now working its way back toward something closer to normal. That’s not comfortable news if you bought near the top, but it’s a healthier long-term signal for buyers locked out during the boom years.
Sources:
foxbusiness.com, realtor.com, fastcompany.com, zillow.com, finance.yahoo.com